This is a second of a contribution provided by mineral industry leaders. Paul Hooykaas, who works as the Product Manager at Micromine, responded to my topography posts by emailing me a historical account of topographic surveying from his experience which I found fascinating and enlightening. I asked him to share his email with our readers as many of the younger generation would be unaware of these details. So today Paul provides Part 3 of the topographic contour series of posts.
Please note that this is Paul's personal opinion and not that of Micromine. - Jun Cowan
I share your dislike for contour lines as a definition for topography. I have a land surveying background, so perhaps my reasons for this are slightly different to yours.
To understand contours we need to step back to the previous century. The year 2000 is quite an appropriate marker for two reasons:
- That was when Selective Availability was removed from GPS, allowing it to become a mainstream technology.
- Although not as clearly defined, it was also signaled the arrival of affordable 3D graphics (in 1998 a Mac graphics card capable of serious 3D visualisation, cost US$3,000)
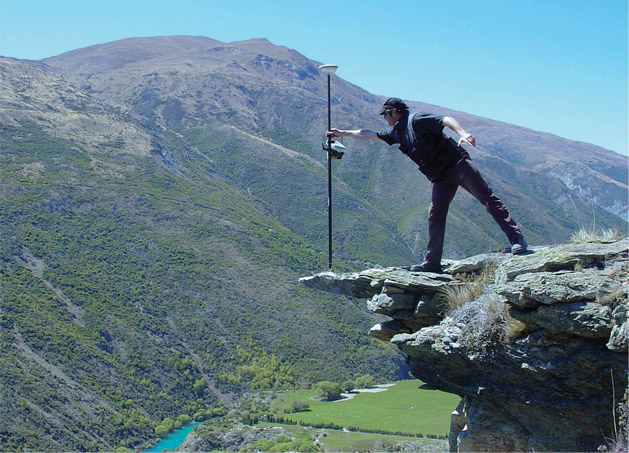
 The good old days! Source: http://huntsvillelandsurveying.com/
Topographic contours - 20th century representation of topography
It is fair to say that in the 1900s contours “ruled”. They were clearly the best way to represent topography both on paper (hardcopy) and with 2D graphics (GIS applications). It is also worth reviewing where these contours came from.
- Small scale projects often involved a land surveyor doing a selective pickup. By this I mean that the measured points were along ridges, valleys, road edges at changes in slope and extremes in height. By choosing carefully the surveyor get can get the best result from a minimal data set. The output effectively becomes “smoothed” by hand drawing contours after plotting the spot heights. Later, computer programs would be capable of generating contours automatically, usually by first creating some type of terrain model.
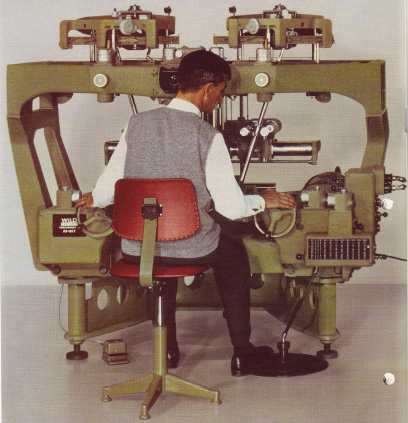
- Large scale mapping was done using aerial photography. The surveyor was again involved by placing and accurately locating, ground control points. Photogrammetry involves looking at two overlapping aerial images through a stereoscope. This provides a three-dimensional view of the land. A stereoplotter uses these photographs to determine elevations. It has been the primary method to plot contour lines since the 1930s By dialing in a elevation, a dot would appear. The trick would be to move the dot so that it appeared to sit exactly on the ground surface. Tracking that elevation effectively produced a contour line. In the 1970s I had the opportunity of sitting at a stereoplotter. With this particular model there were two dots that appeared coincident at a particular elevation. The machine had a couple of wheels that controlled the movement of the dots. The frustration of trying to both move the dots and keep them on top of each other, gave me huge respect for the skill of the experienced operators who zoomed along hill sides with nonchalant ease.

Stereoplotter. The two mechanical hand wheels effectively worked as a 'mouse'. Source: http://www.wild-heerbrugg.com/
LIDAR and point clouds rule in the 21st century!
Today LIDAR “rules” the mapping world. Large scale uses fixed wing aircraft while smaller regions use helicopters. In fact helicopter surveys are becoming common practice for many drilling programs in Australia.
Today’s topographic surveyor is more of a technician. One man and a (GPS) pole can efficiently handle localised pick-ups.
LIDAR is usually associated with a laser scanning device. The technology can be used to generate very precise 3D models associated with architecture and CAD.
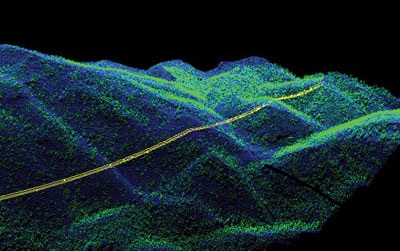
Essentially what happens is that lots and lots of very accurate measurements are made. Far more than are necessary to model the result. The raw data is commonly termed a “point cloud”. The tricky part is isolating the points you want and discarding the rest. In terms of using LIDAR to map topography there will be numerous “false” reflections. Vegetation, power lines and buildings are obvious examples. A lot of pre-processing is required to both filter out unwanted points, stitch together overlapping scans and then work out how to properly model any remaining “noise”. There is some pretty clever software out there to handle this, and it is getting smarter all the time.
 Transmission line is automatically picked by LIDAR processing software. Source: http://www.profsurv.com/
This software invariably produces a mesh, or wireframe, representing the surface. The odd thing is that very often the result is exported as contour lines. . Why? These days very few people actually use contours. All that happens is that they are converted to a Digital Terrain Model (DTM) - which is what LIDAR gives you directly. Alternatively (if you ask nicely) you can get the raw (or partially processed) point cloud data.
To me this is simply bizarre. Far more useful would be to output a triangulated surface. Or wait, better still, several versions of the surface, with different triangle resolutions, so that you can choose one that is fit for purpose.
To illustrate why it is best for the LIDAR contractor to provide a surface, rather than a point cloud, consider a bathymetric example (using similar techniques). An end user might apply the same “topographic” algorithm to model the sea floor. The result would look smooth and realistic. It is only when someone asks “at what stage did you apply the tidal correction?”, that you might reconsider the accuracy of model.
Topography surface from LIDAR is not what you expect
Even topography may not be as simple as it seems. If you viewed a raw point cloud as 3D dots, by rotating it and looking at it from different angles, it soon becomes obvious that a large number of the dots are on a "lowest plane" and the rest seem to float above it. So perhaps we should be modelling the lowest horizon rather than the middle of “noise”. This may well depend on how the data was captured.
In any case, the contractor will almost certainly have both the best knowledge and the specialised software to generate an optimum result. In fact every client should be demanding this output. LIDAR does not come cheap, so the deliverables should be useful. While customers continue to accept contour lines, the geologist will either finish up with second rate surface models or have to do significant post processing themselves.
We are now well into the 21st Century. Times have changed, and contours should be by-products, not the definition of a digital terrain model.
Paul Hooykaas