As Leapfrog Mining can handle many different types of files from a large number of General Mining Packages (GMP) it has almost become the defacto program for presentations in the boardroom for some companies. I am commonly asked to set up projects and images for Leapfrog-based presentations and slideshows and this sometimes leads to a requirement for “out of the box” thinking. Two recent examples were:
- Can you set up a scene that shows all the drilling since the last resource was published, and also shows all of the drilling completed to date on the project.
- Can you assess the assay data from the recent round of metallurgical drilling and compare it against the adjacent resource drilling as we think there is an issue with the Metallurgical assays.
To answer both of these questions we can utilise the Query building functionality of Leapfrog Mining but to do this you must have set up your project correctly first. I have a project set-up for each project that pulls data from an automatic CSV export that comes out of the database every night. Updating the Leapfrog database is as easy as using the Reload Drillholes option.
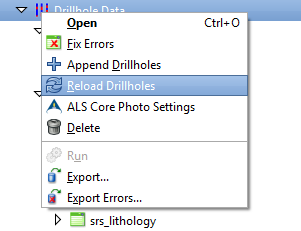
Leapfrog Mining project must be set up correctly first before query building functionality can be used effectively
Not only does this update the complete database to the latest data, it ensures that I always have a project that is ready to respond to any query our Executive fires my way…well almost always, they always manage to find something that requires more work! It also updates the geological model and grade interpolants utilising the latest data so that we can evaluate changes to the project on an as they happen basis (although some of my bigger projects take up to 2 – 3 hours to process so it is not something I can run at short notice). Setting up your project correctly is essential; you must ensure that you import all the attributes that you think will be required in the future. Whilst it is possible in Leapfrog to add columns to interval tables, it is not possible to add them to the collar file, it is therefore well worth adding as many columns as you can to the collar file the first time around. Columns such as DH Type, Project, Purpose, Phase, Status, Date Started, Date Complete and any other category you wish to add should be included as this allows you to generate collar queries that select various drillhole groups.
It enables you to extract two sets of data from the one source in order to assess the different influences and contributions to the overall model that the individual datasets have, ie RC vrs Diamond, Company1 vrs Company2, select the area of influence for a certain distance around a metallurgical hole in order to test its validity and representivity. To do this in Leapfrog you follow the procedure outlined below. - Create a query on the collar file by right-clicking on the collar table and selecting New Query Filter.
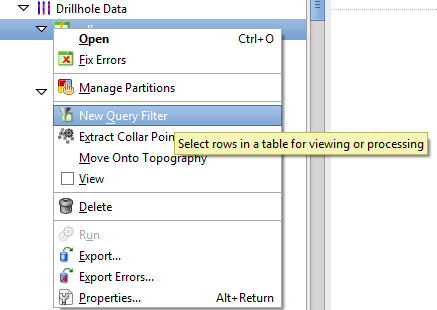
- Select those holes you are interested in, such as a selection of holes representing metallurgical test work are selected or you could select by Hole Name, company, hole_type etc – depending upon what fields you have imported with your dataset, you can type the query directly if you understand the syntax;
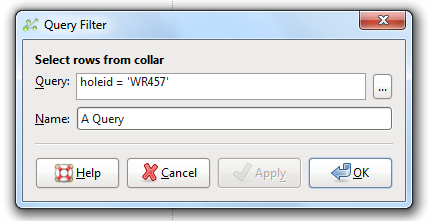
- Or you can use the Query Builder to help;
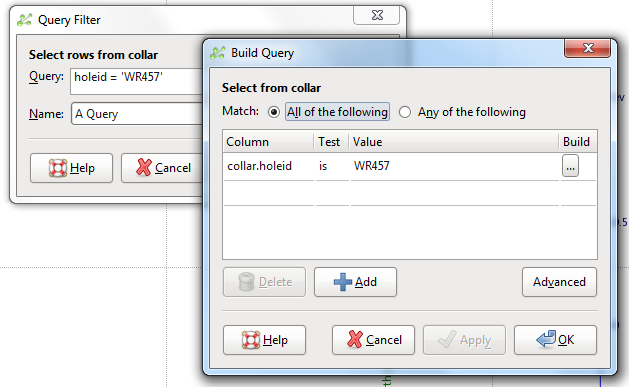
The build button will search the column and present all the values that relate to that column.
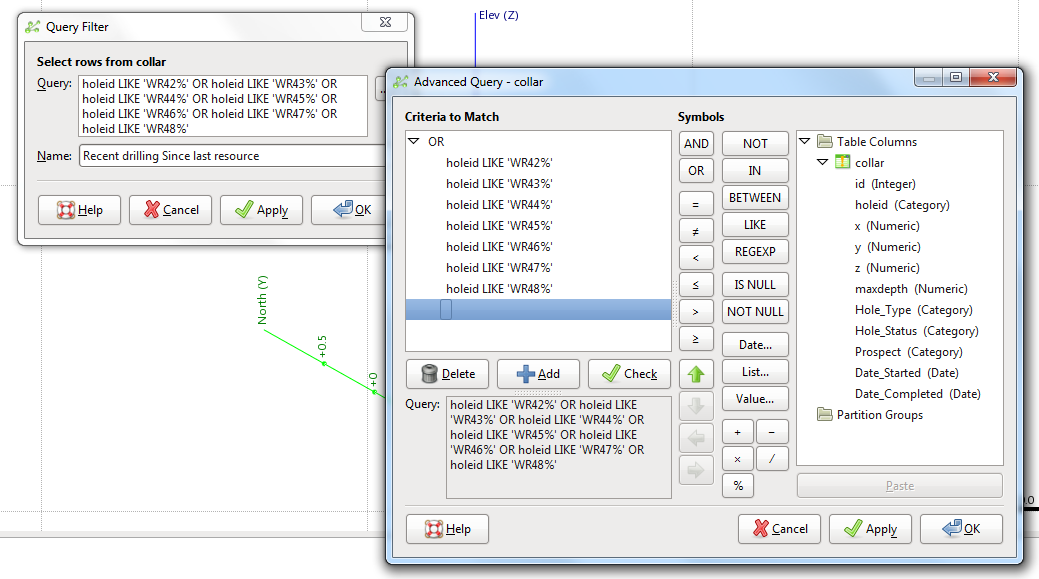
- If you are feeling adventurous you can utilise the advanced option which allows you to build much more complex queries;
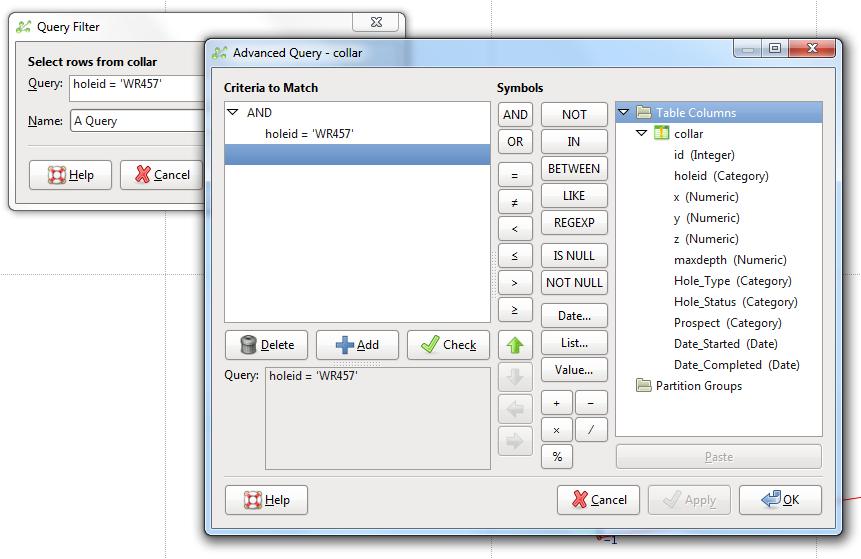
- Once you have your query click OK, give the query a name and OK again;
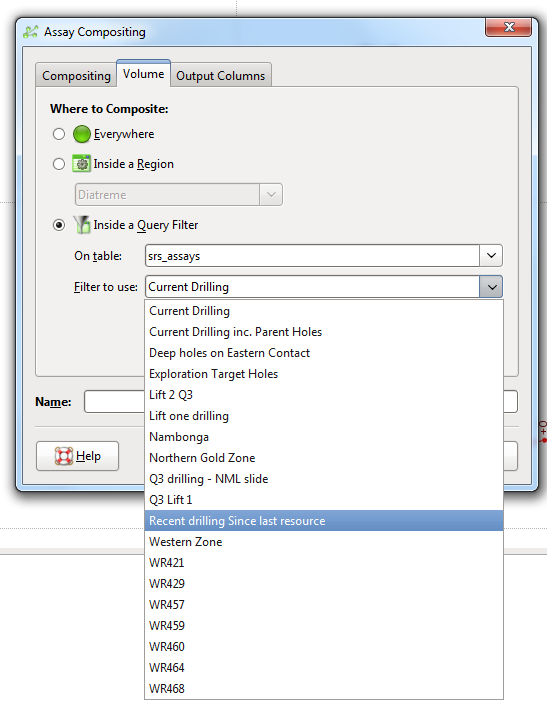
- Create a region on the assay table by right-clicking on the assay table and selecting Composite Assays, on the Volume tab you select Inside a Query Filter and select your Query;
I always composite my data, if only to make it easier to read the assays on screen (also for basic statistical reasons) but you can ignore the composite option and extract the raw assays if you wish. Give the region a representative name and click
OK.
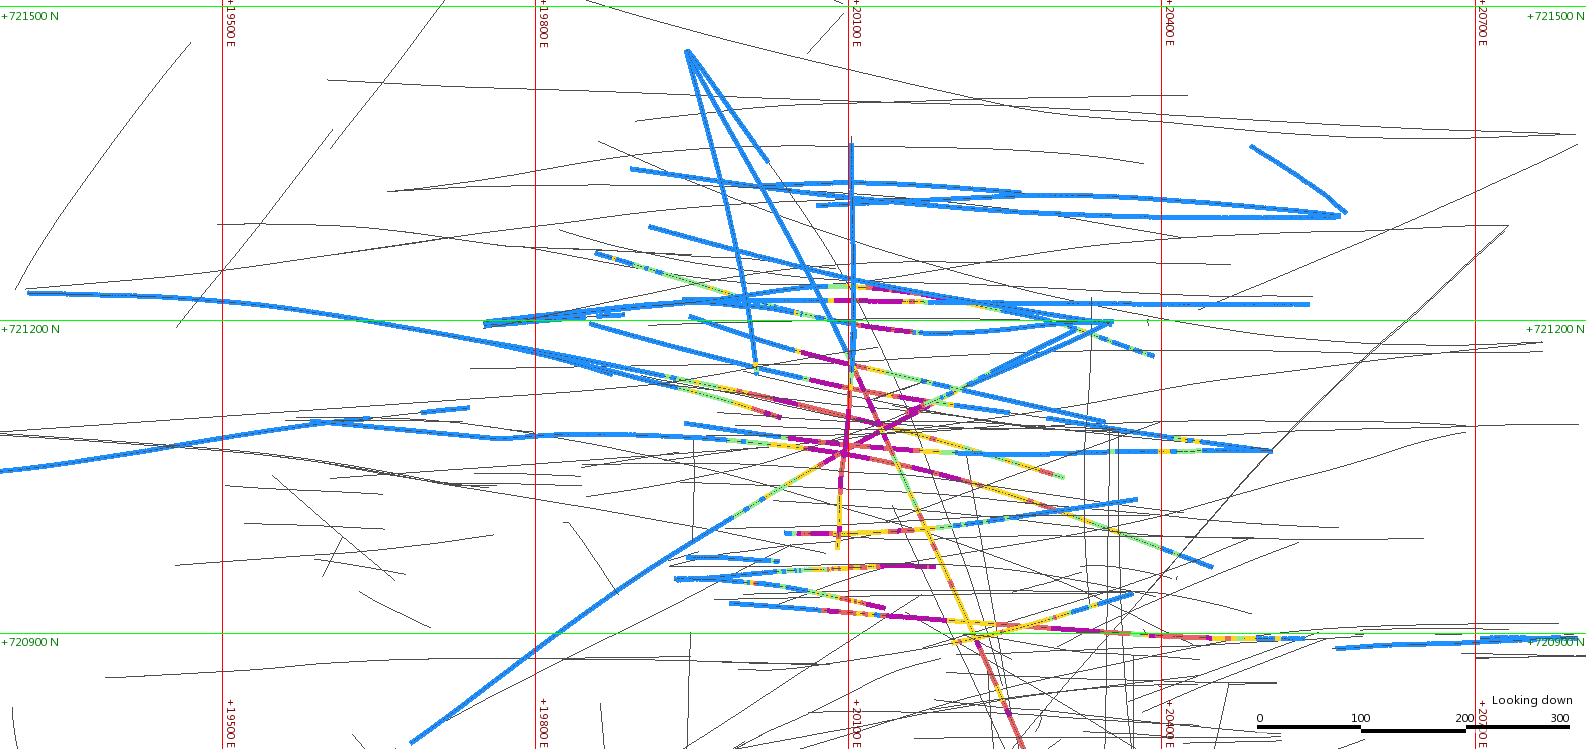
- At this point you can accomplish point one I was asked above, can I display the drilling completed since the last resource at the same time as all the drilling so far completed. Below I have loaded the composite file generated using the query filter and a drillhole trace line width of 5, and loaded the assay file with no filter and a drillhole trace line width of 1 and a flat colour (of course you could also colour it by assay).
To answer the second query you need to go further;
- First you extract the composited points to numeric data by right-clicking on the composite file and selecting Extract points → Assay points.
- From this numeric data you can assess the grade distribution, model grade shells (if enough data exists) and generate distance buffers around the selected drilling in order to select areas of influence.
- The process of creating a distance buffer to select data is quite simple, first you create a distance buffer around the extracted composite or assay file;

- Then generate a domain using that distance buffer at the distance you want to study eg;

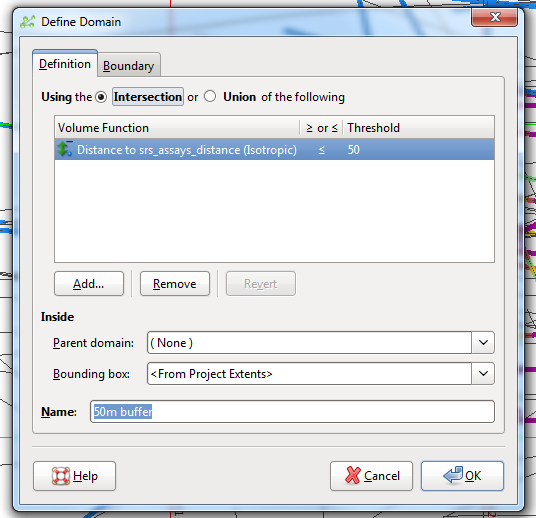 You could select a mesh surface here instead of the distance interpolant, I always use the interpolants rather than the meshes as it makes the processing quicker and making adjustments to the domain is as simple as adjusting the threshold.
Below I have generated a distance buffer around some met holes in order to run the comparisons between the met holes and other samples within a certain distance from the Met drilling.
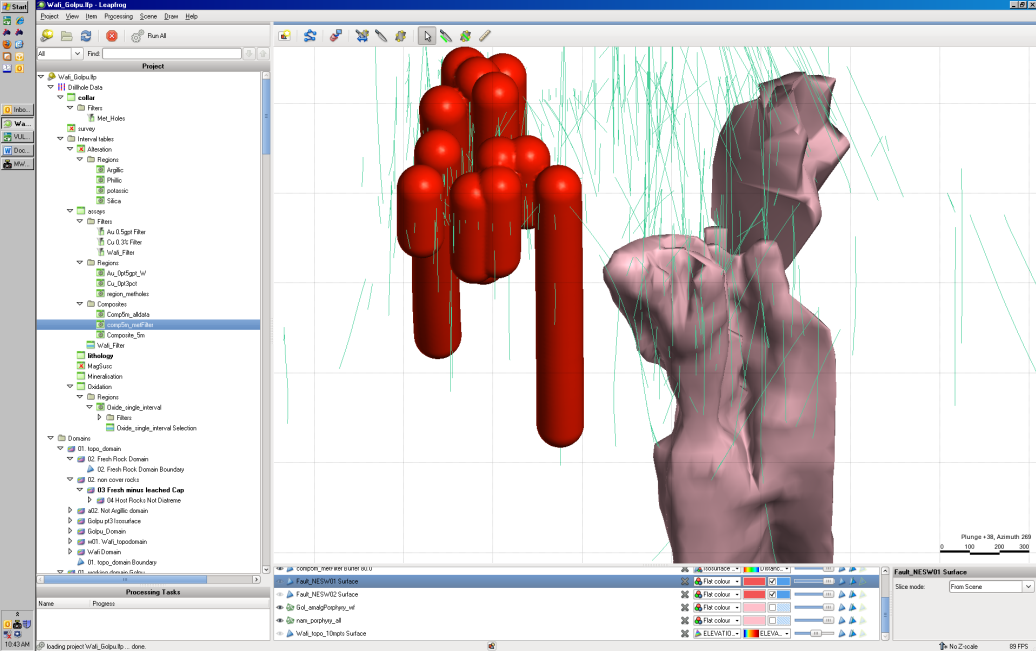
- Once you have the distance buffer domain you can select out the data within this domain for analysis (you are presented with two options – to use the interpolant or use the mesh, again I always use the interpolant).

- To answer the 2nd query you need to extract two lots of data, in this case the Metallurgical data only inside the domain, and then the “not metallurgical Data” that also sits inside the domain. The metallurgical data you already have through generating the domain to start with, to get the second non metallurgical set you make a copy of the metallurgy query and change the query to “is not”, for example if you had the query collar.purpose = ‘Metallurgy’ the query would become collar.purpose != ‘Metallurgy’. Then you create a composite file using this query and extract these assay points in addition to the original metallurgical set. Here I have demonstrated using a single drillhole but the principle still holds.
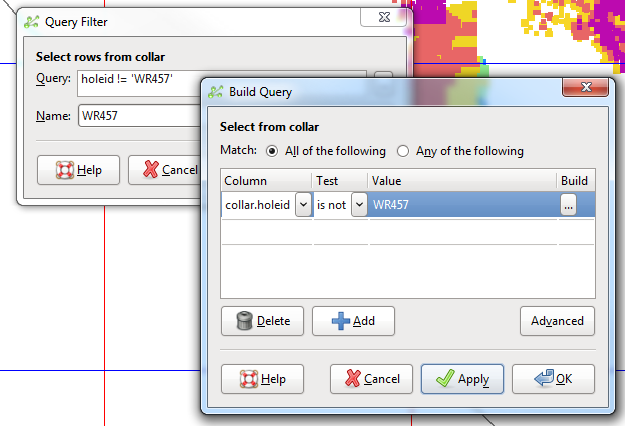
- The final step is to use your domain to select the relevant subset of the Not Metallurgy composite data and you now have two datasets that are spacially related to each other.
- With the two sets of data it is now possible to do some basic analysis using the properties tab in Leapfrog, or you can export the data to csv files and do the statistical test in whatever flavour of spreadsheet or stats package is your thing.