In
Part 1 of this blog post I said that the following statement is a fallacy:
“Interpreting in section and in plan is the most reliable way we can understand the geology of the deposit.”
In other words, drawing and interpreting in multiple sections does not necessarily lead to a clearer understanding of the geology of the deposit.
The 2D section test
To demonstrate that the above statement is a fallacy, I showed you a sectional view of an object in
Part 1 of this post and asked you to guess the object (see Figure 1).
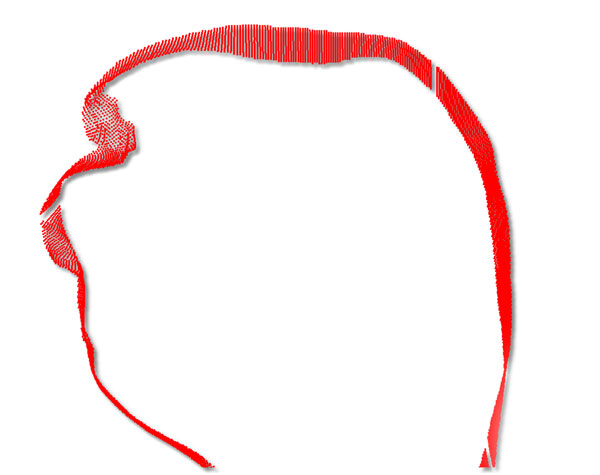 Figure 1. Sectional view of an object. What is the object?
A different sectional view makes the 3D object a little more obvious:
 Figure 2. Another sectional view of the object shown in Figure 1.
This section makes it obvious that the 3D object is a human head, so clearly we don't have to exhaustively digitise outlines of objects in multiple sections to understand 3D objects. This argument can be extended into the field of geology.
The section that you see in Figures 1 and 2 in relation to the head is shown in Figures 3 and 4 respectively.
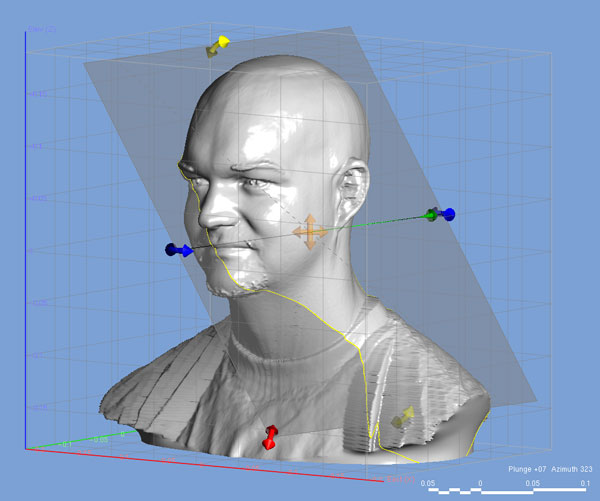 Figure 3. Position of oblique section shown in Figure 1.
  Figure 4. Position of symmetry section shown in Figure 2.
When I play this guessing game during a Leapfrog modelling workshop, the audience usually laughs and I can see from their faces that they realise they have been tricked, but at the same time I can see that a light bulb goes off in their heads.
While everyone (i.e. 100% of the audience) correctly guesses that the 3D object is a human head from viewing Figure 2, only about 5% can guess the correct answer from the sectional shape shown in Figure 1.
Two key requirements for rapid interpretation
There are two distinct and separate processes that allow us to recognise the human head from a single 2D section:
- The section shown in Figure 4 is a special section and, out of an infinite number of sections, this is the only section that lets you interpret the 3D object from a single 2D section. This is called the section of symmetry, or the reflection plane. As you move away from this plane, the probability of recognising the 3D object diminishes rapidly.
- The other half of the process is experience. As humans, we intuitively know what other humans look like, and this is why we can recognise the profile of a face in the symmetry plane. If we didn’t know what humans look like, then seeing the pattern in a reflection plane will not necessarily help connect the 2D image with the 3D object.
I did not use a geological example here because not everyone will intuitively understand a geological example even if they are a geologist, whereas 100% of those reading this post understands what the human head looks like. The simple prerequisite to be able to do this exercise is that you must be human, so this is why the example above is used to illustrate this concept.
How can we apply this to the analysis of geological data and mineral deposits?
To be able to quickly recognise the meaning of geological objects simply requires the same two conditions as described above.
One is the ability to determine the symmetry of the system. However, drillhole fences are
rarely on the symmetry plane and thus we are unable to see the patterns. Perhaps the only time we can use vertical sectional views containing drillholes is with horizontal layer-cake stratigraphic systems where there are infinite vertical symmetry planes; however, our experience indicates that this is a rare condition in mineralised systems. In almost all cases, the symmetry plane is oblique to the drillhole fences.
Once you determine the correct sectional view, the meaning of the patterns that you see requires you to recognise what they actually mean, and the prerequisite for this is experience at seeing and understanding the significance of the objects. Thus the geologist has to have some type of theoretical framework to enable rapid interpretation of the data patterns using heuristics. Heuristics is a 'rule of thumb' or a mental shortcut that allows you to recognise patterns quickly without exhaustive and time-consuming analysis (algorithmic). You used heuristics when you looked at the profile of human head in Figure 2 and quickly inferred the 3D object; there was no need for extensive analysis.
Our approach is to use structural geology
The approach we take at Orefind is where I would expect a divergence of industry opinions and some heated debate. The framework that we work with at Orefind is structural geology.
It is no secret that Brett Davis and I have a strong belief that almost all mineralised systems are structurally controlled in one way or another. Virtually all mineralised patterns and alterations can be logically explained in terms of some type of structural model and geometry, and we’ve come to this conclusion from experience at modelling and from working on hundreds of deposits. Some may state that our views might simply be a case of confirmation bias, but we challenge anyone who can demonstrate otherwise using real data.
A quick search through the economic geology literature reveals that our views represent a minority, or perhaps the minerals industry as a whole is uncommitted because this issue has not been specifically addressed.
The rest of the academic economic geology community, where all the theories and hypotheses of the origin of mineralisation styles have been established, do not view structural geology as a key and fundamental issue. In fact, very few papers on the analysis of ore deposits involve the documentation of 3D geometries and the structural understanding of deposits. Some key theories of mineralisation, such as those pertaining to VMS, SEDEX, and even orogenic gold deposits, have largely left the investigation of 3D geometry of mineral systems out of the discussions; to me, this is a perplexing oversight that has gone on for many decades.
The Deposit Model Paradox
Most objects we are familiar with are classified according to geometry. This can be simply demonstrated by searching for 'dog classification' (as an example) in Google Image Search (Figure 5). Note: All searches and their results, as discussed below, were conducted on 12 March 2013.
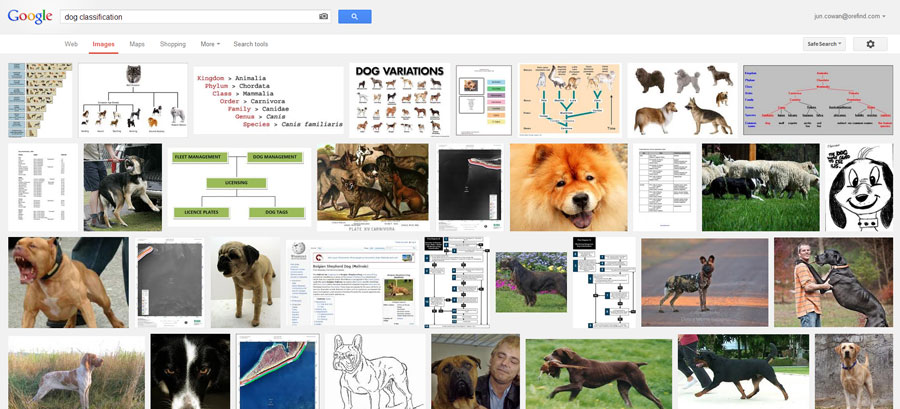 Figure 5. Results of a Google image search for 'dog classification'. 3D geometry of dogs is clearly important in the classification of dog breeds.
Contrast the above with a Google image search for 'ore deposit classification' or 'ore deposit models'. The results are somewhat underwhelming (Figures 6 and 7), with tables, charts, and line drawings being the most prominent result; clearly illustrated 3D models of various types of deposits do not appear to exist.
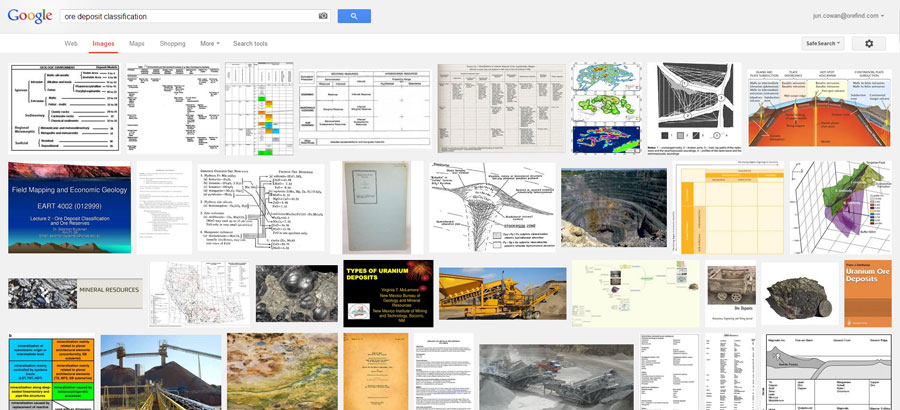 Figure 6. Results of a Google image search for 'ore deposit classification' largely results in mostly tables or cartoon cross-sections that are not based on real 3D models.
 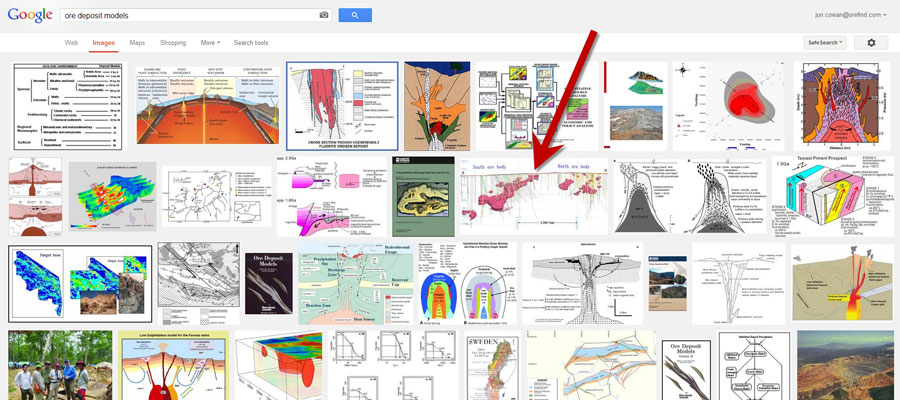 Figure 7. Results of a Google image search for 'ore deposit models' again shows the general lack of true 3D models built from real data, but has many schematic cartoons and cross-sections.
From these simple Google image searches, we can conclude that ore deposits are not primarily understood on the basis of 3D geometry that is modelled from real drillhole data (
Cowan 2012). The theoretical geometries of ore deposits are schematic and are not based on real data and real geometric constructions! Coincidentally, the arrowed 3D model shown in Figure 7 is the
only 3D deposit (Oyu Tolgoi porphyry) representation that appears in the
Society of Economic Geologists' One Hundredth Anniversary Volume (1905–2005) (Hedenquist et al. 2005, see
Cowan 2012 for discussion). In that massive 1136-page treatise of theoretical ore deposit models, there is no other 3D model of any type of mineral deposit!
We contend that, without the documentation of 3D geometry, it is simply not possible to understand the role of structural geology in mineralised systems. Unfortunately, the lack of documentation of the 3D geometry of deposits is industry-wide, and it has been like this throughout the last 40 years even with the advent of software that allows construction of 3D geometries of ore bodies. Without the documentation of ore deposits in 3D, the industry lacks a formal and universal system that allows geologists to interpret deposits effectively and quickly.
Using the analogy of a human head, minerals industry geologists simply do not know what the human head (i.e. the geological deposit) looks like. If there is no framework, there is no heuristics in operation. This is a controversial statement, which does not apply to all ore deposits currently being mined and explored; however, I believe the facts illustrate that generally this is the case.
Our system for rapid modelling of mineral deposits is:
1. Identify the symmetry systems from the raw data.
2. Use structural geology heuristics to analyse and model deposits.
As a whole, the industry is indifferent to this approach, and in some cases would be against it due to ingrained habits and assumptions that stem from theoretical deposit models. However, there is nothing that prevents our approach being used and tested for the benefit of advancing industry knowledge. We don’t believe we are contradicting economic geology academics as they largely lack the understanding of 3D geometries of ore deposits, although we can see that some may be upset by our conclusions.
The paradoxical situation, which I termed the 'Deposit Model Paradox', occurs when academic ore deposit model conceptualisers don't have a clear understanding of the 3D geometries of the mineral deposits they analyse.
This leads us to clear business opportunities.
In fact, the very existence of the Deposit Model Paradox was the primary driving force for me conceiving Leapfrog software back in 2001. This is a critical detail for why and how Leapfrog was developed. (Note: Leapfrog is now marketed as Leapfrog Mining.)
I will talk about why Leapfrog software was developed in future blog posts.
References:
Cowan, E.J., 2012,
The Deposit Model Paradox, Structural Geology and Resources 2012 - Extended Abstracts Volume (ed: J. Vearncombe), Australian Institute of Geoscientists Bulletin 56, p. 48–49.
Hedenquist, J.W., Thompson, J.F.H., Goldfarb, R.J. and Richards, J.P. (eds), 2005, Economic Geology One Hundredth Anniversary Volume (1905–2005). Society of Economic Geologists, Littleton, Colorado.