Recently I wrote a post about how a
90% mineral resource downgrade could easily occur as a result of bias in the form of habitual behaviour. People often do not fully realise how extreme or
entrenched human bias can be, nor the implications it has with regard to our scientific and business decisions. The purpose of this post is to illustrate a simple geological bias that can be demonstrated by anyone. As is the nature of any bias, this particular bias is virtually unknown in the geological profession. We'll examine the origin of this bias, and then I will share how I take advantage of widespread bias in my own business as a mining industry consultant.
My epiphany
Around 1990 when I was studying for my PhD at the University of Toronto, I learned something that was to change the way I viewed fellow geologists. It was nothing to do with my research, but a single sentence that I overheard at a student-faculty party that stopped me in my tracks and changed the way I thought. That sentence?
“Did you know that most geologists will draw an antiform, as opposed to a synform, if you ask them to draw a fold?”
The person who made the statement couldn’t tell me the source of this claim, but it was the implication of this statement that really fascinated me. After all, if asked to draw a fold profile, I would instinctively draw an antiform too.
“Could geologists be this biased?” I wondered.
This claim bothered me for years, so I set up an experiment to test this hypothesis of bias. I want to share the experiment with you in this post, as well as its outcome and implications, because the result of this simple experiment unexpectedly shaped my career direction in the mining industry. It might shift your perspective as well.
The Fold Experiment
Eight years later I was in Perth working as a Postdoctoral Research Fellow at the University of Western Australia (UWA) and I decided to test this hypothesis. I devised a simple experiment, but first let me explain what I was testing.
If you ask someone to choose between black or white, there’s a 0.5 probability for each of black or white to be selected. If you repeat this experiment many times by asking a population of people, approximately 50% will choose white, and the other 50%, black. This is a binary choice experiment, and the outcome is very predictable.
With the fold experiment, instead of a choice between black or white, the choice is based on a geological choice, and the question is:
“Imagine a single fold profile. Do you see a synform or an antiform?”
The choice between an antiform and a synform each has a 0.5 probability, so it’s identical to a choice between black or white. If you get a computer to randomly select between a synform and an antiform and do this experiment many times, the probability curve of the antiform bias would look like Figure 1. The peak of the bell curve sits right in between the synform and antiform options.
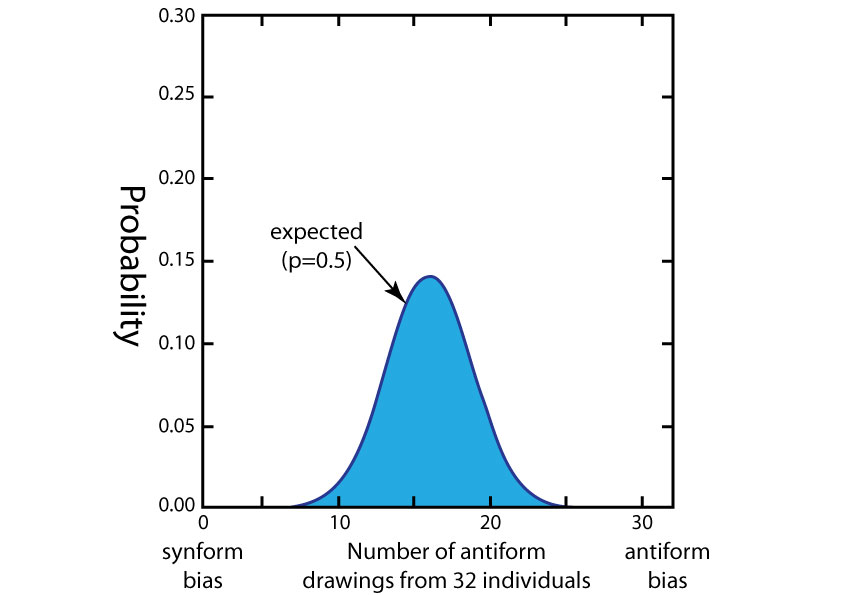 Figure 1
Non-geologists who choose between synform or antiform produce results similar to the computer results (Figure 2).
 Figure 2
The results in Figure 2 are based on a random survey of 32 people I conducted on UWA arts and commerce students who had no prior exposure to geology. I just walked up to a student at the UWA campus and my first screening question was “Do you know anything about geology?” If a student hadn’t studied geology or wasn’t exposed in any way to geology, then they became part of the control group.
The students had to complete the activity sheet shown in Figure 3 and Figure 4 shows a completed example.
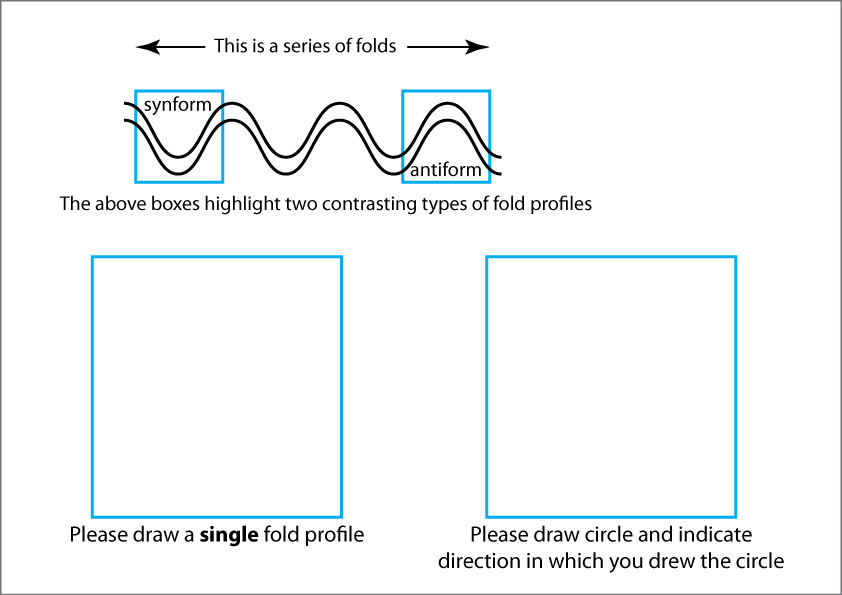 Figure 3
 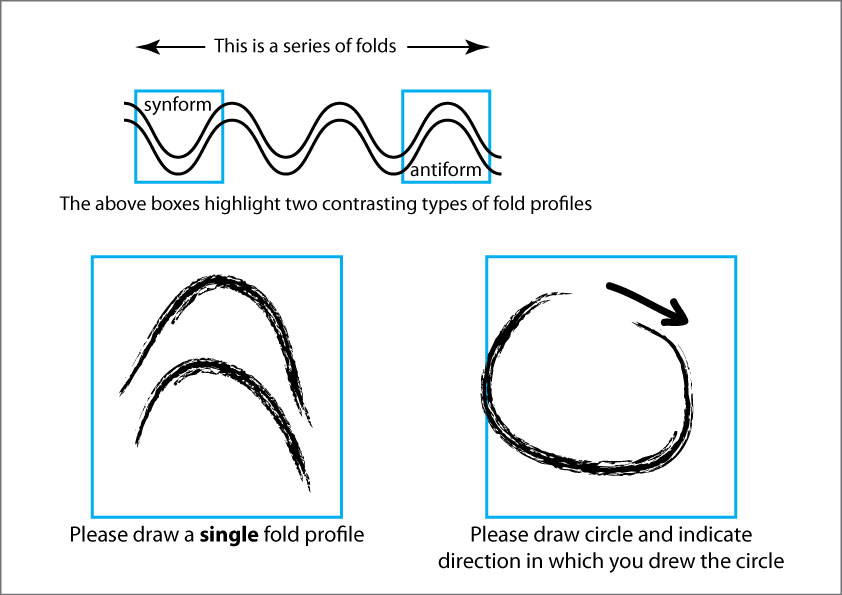 Figure 4. A completed activity sheet. The question about the circle was to see if there was a relationship between the type of fold drawn and the way people drew circles. There was no statistical relationship between the two.
Geologists are not like computers
So, given that I knew the control group of non-geologists acted pretty much like a random choice, it was time to find out how geologists responded to the same question.
The result is illustrated in Figure 5. The pink bell curve shows a very strong antiform bias, and is the result of my 1998 experiment at UWA with 32 geology students and staff using the same activity shown in Figure 3. The statement I heard at that party almost a decade before was thus proven correct with this simple experiment.
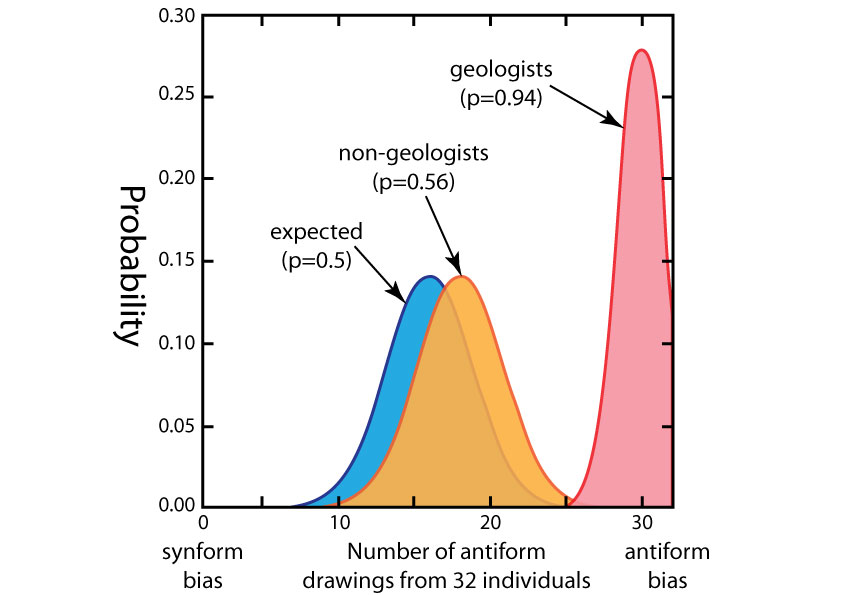 Figure 5
In fact, the results between the geologists and non-geologists are so different they can be considered two completely different populations.
The overlap of the probability curves is so minimal that we are likely to get a biased result from geologists, no matter how many geologists we ask.
The bell curve indicates that 9 out of 10 geologists, if asked the question of what fold they are imagining, will answer antiform in preference to synform.
Testing on a larger population
These results were so striking that I wanted to repeat this experiment at a much larger gathering of geologists. I finally got around to doing this at two large geoscience conferences more than a decade after my original experiment. The conferences were the 2011 AusIMM Mining Geology conference (Queenstown, New Zealand), and the 2012 AIG Structural Geology and Resources conference (Kalgoorlie, Western Australia). At both conferences, about 300 people were in each of the auditoriums when I asked the fold question. In each case about 15 people put up their hands in favour of synform, while the majority of the crowd favoured antiform, thus providing proof and confidence that the results of my 1998 experiment can be scaled. (Unfortunately I haven’t had the opportunity to conduct a similarly large-scale control experiment using a large number of non-geologists.)
For the larger crowds I have not used the worksheet from Figure 3, but instead have asked the participants to imagine a "profile of a fold." I then asked them to raise their hand if they imagined a synform, and followed with asking for a show of hands if they imagined an antiform. Figure 6 shows a typical result in a classroom setting.
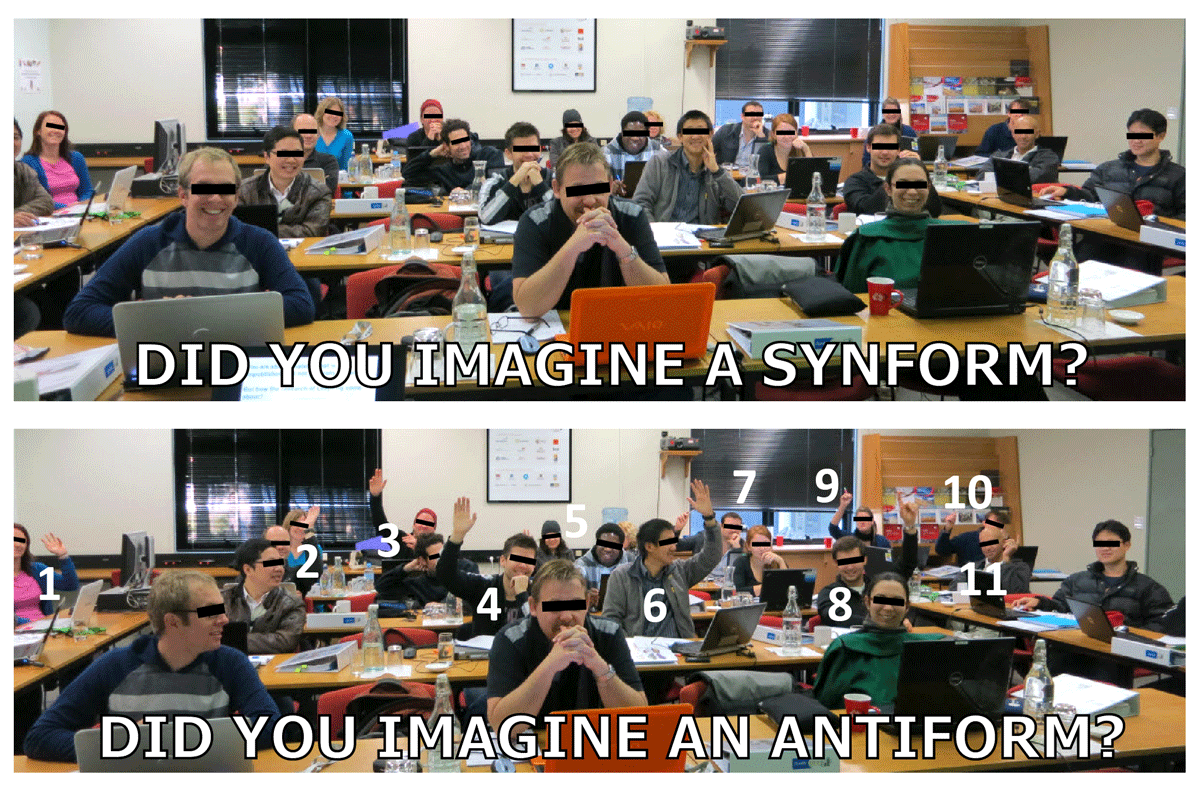 Figure 6. During a 3D modelling course at the University of Tasmania, 21 MSc geology students were asked to participate in the fold test. 10 students did not vote, but out of the 11 students that did vote, 11 imagined an antiform. No one imagined a synform.
What I have found from experience is that what ought to be a 0.5 probability outcome, is a 0.9 to 0.95 probability in favour of antiforms if you ask the fold question of a geologist. Several people have told me that they conducted their own experiments in their work environments and, predictably, the results were the same as mine.
Try it now on an unsuspecting geologist colleague who shares your office, or phone a geologist and ask the question. Repeat this ten times and see whether you get the same 9/10 result that I got every time.
In his bestselling book
The Signal and the Noise, Nate Silver discusses how professional gamblers take advantage of the very small percentages in their favour to make a living from gambling. In the case of geologists and the question about synforms and antiforms, there’s a 9 out of 10 certainty that you can predict their answer—not 5 out of 10! This is a remarkable contrast and is probably unprecedented for such a simple binary choice experiment. View the pictures of the roulette wheel that represents how a computer sees this antiform (black) vs synform (red) draw (Figure 7), as opposed to how the geological community sees antiform vs synform (Figure 8), and you’ll realise the startling difference.
 Figure 7: A computer’s antiform vs synform pick shown as a roulette wheel (ignoring the green we have 50% red, 50% black).
  Figure 8: The geologists’ antiform (black) vs synform (red) pick shown as a roulette wheel.
But why this highly skewed result?
The result of these fold experiments are quite remarkable.
It’s a bit like discovering a group of people somewhere in the world who, when given a free choice between black and white, consistently pick one colour 9 out of 10 times.
This is remarkable, of course, but what is truly remarkable is most geologists are completely unaware of this bias.
While geologists are curious about this result, they are often not shocked by it. Astonishingly, most geologists think this result is natural and quite normal, and I have found that they’ve often come up with imaginative reasons why geologists behave this way (e.g. "Antiforms are happier!").
But there is nothing normal about this asymmetry and departure from what should be a coin-toss probability, so the next obvious question is:
Why is the outcome so skewed?
Well, I don’t exactly know why, and I will speculate here, but I did search for research papers on the psychology of geological interpretations. However, there’s very little research on this subject and although I’ve not done an exhaustive search, I speculate that fewer than 20 papers have been written on the subject since the 1970s.
I could only find one experimental study that was anything like my experiment and that was conducted by structural geologist and psychologist Peter K. Chadwick who published his result the journal
Nature in 1975. The conclusion Chadwick reached was that humans were hardwired to see antiforms over synforms (Chadwick, 1975, 1982). This conclusion was based on eye tracking experiments performed on 20 geologists and 20 non-geologists. The eyes of both groups of people preferentially looked at antiformal closures.
However, the results of my experiment are not consistent with Chadwick’s conclusion—my control group of 32 non-geologists showed a completely different result compared to 32 geologists when they sketched fold profiles. When I chose my test candidates from the UWA campus in 1998, I made sure that the students in the control sample did not have any prior exposure or have any casual interest in geology . I deliberately chose those who had no idea about geology, so if an accounting student from Hong Kong asked “What’s geology?” then they were the perfect candidate for my experiment.
My guess is that the antiform bias seen in the results from the geological community is due to subliminal conditioning caused by the geological education process. The only difference between a non-geologist and a geologist is their education. If you think back to your undergraduate years, you may recall that when you were first introduced to folding, you were most likely shown a picture of an anticline, not a syncline. If you examine any number of geological text books, you will notice that this pattern of biased illustration of antiforms over synforms is repeated (Figure 9).
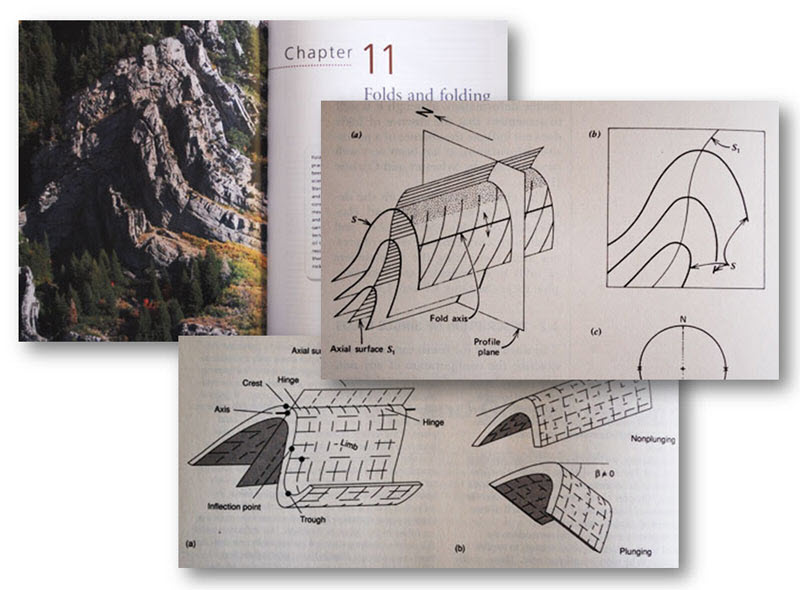
Figure 9. Most geology text books show pictures of antiforms when they introduce the concept of folding.
Implications of the ‘Fold Test’
I’m suggesting that the antiform bias that we geologists have is a consequence of unintentional brainwashing, and a sure sign of brainwashing is that those who are brainwashed have no idea that they were brainwashed. Perhaps there is a bias in the way academic geologists preferentially illustrate antiforms in textbooks, as Chadwick (1975) had speculated, but I think this effect is further amplified by geology students who absorb and then repeat this pattern without thinking.
If this extreme bias that we see in our geological community is due to passive and unintended brainwashing, then consider the outcome if a message is pounded into us intentionally and repeatedly by an enthusiastic and charismatic academic or industry leader. These ideas could be mineralisation models (eg Shear-Zone Hosted Gold, SEDEX, VMS), or some geological theory (eg Plate Tectonics, Expanding Earth), or they may be a habitual analytical process, as I’ve addressed recently about
mineral resource estimation downgrades.
This brainwashing is no different to that used in product advertisements—after a while you become oblivious to what you are told repeatedly, and eventually it just becomes part of your language and even thinking. You don’t question it, but simply accept it, and the ideas are interwoven with your beliefs, without you ever realising that you were brainwashed in the first place. Any ideas that are counter to what you are told are rejected without any rigorous testing. Everyone else exposed to the same brainwashing messages is in the same boat and everyone agrees with each other.
But what if the message you were told for decades was actually wrong? What if the exploration model that your company uses is incorrect and cannot represent nature, yet everyone around you is brainwashed to believe it? This could be costing your company a lot of money, perhaps millions of dollars every year.
It would be a difficult job to turn your thinking around because you’ve been told the message over and over again. It just becomes part of you so you vigorously defend it, even if it was an idea invented by someone else. It’s been in your system for so long that it simply becomes part of your thinking. In fact, it becomes part of the community so when the bias is pointed out (such as the fold bias), you don’t quite grasp the extreme (9/10!) nature of it.
With this sort of bias and entrenched thinking, it’s not surprising that major scientific breakthroughs don’t happen very often.
This is the scary implication of the fold bias if extrapolated to other parts of our professional lives, but how can we learn and make practical use of the realisation that such biases exist?
I became a contrarian because of that simple statement I overheard at a party when I was a grad student nearly 30 years ago. A contrarian consciously determines what the majority are doing or thinking (this is not as easy as it sounds), and then thinks exactly the opposite to seek out untapped opportunities.
Fifteen years ago, I came up with the Leapfrog software concept, which is now regarded as mainstream mining/exploration software, but back in 2001 I was completely alone in thinking that 3D interpolation could replace traditional sectional digitisation. In my mind, I could visualise this happening. However, most geologists, including many of my work colleagues, and, without exception, all the mining software companies I talked to, thought the idea was a bit loopy. The hardest sell was to mining consulting companies, and in the early years I never achieved long-term sales to any of the consulting companies. It is ironic to see consultants who rejected the software back then are now singing the praises of Leapfrog software, but that is the way herds behave. Herds rarely head off in a direction unprompted, unless they see a substantial number of animals heading that way. Herds are not easily led by a delusional lone animal.
But as a contrarian thinker, I soon realised that actively thinking the opposite can present untapped business opportunities because of the complete lack of competition. A lone sheep can come across vast green pastures where there are no other sheep to compete with.
However, profound changes that go against the herd mentality do not happen overnight—it took many years for the mining industry to see the value of Leapfrog software, and even now, most geologists who use it don’t realise how powerful it is.
There are many untapped business opportunities in the mining industry that are the direct consequence of human bias (which I will cover in future posts), but before you can see these opportunities, you must become aware that geologists are highly biased. If you don’t believe me, I dare you to try out my experiment and ask an unsuspecting geologist the fold question:
“Imagine a single fold profile. Do you see a synform or an antiform?”
---
This post (modified from the original Sept 2013 post
The System), was published first on LinkedIn on 15 Feb, 2016.
Acknowledgement
Dr Stefan Revets for discussions and help with the statistics in the original 1998 UWA study.
References
Chadwick, P.K., 1975, A psychological analysis of observation in geology. Nature 256, p. 570-573.
Chadwick, P.K., 1982, “Earth-boundness” in geological observation. Geology Teaching – Journal of the Association of Teachers of Geology, 7(1), p. 16-22.
Sliver, N., 2012, The Signal and the Noise: The Art and Science of Prediction. Penguin Books, London.